
How to research NFL receptions props: targets, target share and catch rate
A receptions prop is a bet on catch volume. Start with targets and target share, check how often those throws become catches, then adjust for the quarterback, injuries and game context. Count how often the player cleared your exact line, with the sample visible, and compare the price. A high average alone isn't enough.
Use this method alongside the broader NFL player props research guide. If you already have a number, check a receptions prop free.
What a receptions prop is
Over 4.5 receptions needs five catches. Under 4.5 needs four or fewer. A 2-yard catch counts the same as a 60-yard catch.
A target is a pass intended for a player, caught or not. Catch rate is receptions divided by targets. For a completed sample with targets:
Receptions = targets x catch rate
That describes past catches. Using estimated targets and catch rate for next week gives a rough expectation, not the probability of clearing a line.
Step 1: Targets come first
Read targets per game first. Target share is the player's share of his team's targets in the same games. PlayerProfiler's metric guide explains why the team's passing volume matters alongside that share.
Multiply share by expected team targets, not all pass attempts. Throwaways aren't targets to a receiver, and providers can use different denominators. WagerLens calculates its team target share from matched player and team game-log targets.
Route participation asks how often a player runs a pass route when his team drops back to pass. Snap share includes blocking plays, so it isn't a substitute. Routes don't guarantee throws.
Check whether recent usage reflects a role change or an outlier. The NFL players hub is a starting point for individual research.
Step 2: Catch rate depends on the throws
Short throws generally offer different catching opportunities from deep shots. Lining up inside, in the slot, doesn't guarantee short routes. Neither does a tight end or running back label.
The NFL's Next Gen Stats route study found a 79.7% catch rate on flat routes (short throws toward the sideline), versus 34.1% on go routes (deep downfield), for receivers aligned outside the backfield in 2018-19. Those historical league rates aren't today's player projections.
Average depth of target describes how far downfield the intended receiver is, relative to the line of scrimmage. Read it alongside catch rate. The NFL's completion probability explanation also considers separation and pressure. Catch rate isn't pure receiver skill; a recent perfect rate won't necessarily last.
Step 3: Check the quarterback and game script
A quarterback change can alter accuracy and where targets go. Don't assume a backup automatically feeds the running back; look for evidence of that distribution.
Game script means how the score shapes play calling. An underdog may throw more while trailing; a team protecting a lead may run late. The spread, a points handicap, doesn't promise either workload.
A high game total means more expected combined points, not necessarily more passes. Explosive plays can produce points without many catches. If you're combining props, the same-game parlay guide explains why shared assumptions matter.
Step 4: Find out who's out
A teammate's absence opens a question: who actually gets more routes and targets? Don't simply transfer the missing player's workload to the next name on the depth chart.
Compare games with similar personnel and keep that sample separate. Check the receiver's availability too. Being active doesn't establish a full workload. Our injuries and player props guide covers these checks.
Step 5: Read what the defense allows
Use receptions allowed to the relevant position, with the period and sample attached. A defense's catches allowed to all wide receivers combined aren't a forecast for one receiver.
Position groups aren't slot-versus-outside splits. Only use alignment-specific claims when the source provides them. Opposing personnel and how often opponents threw also affect the totals. Matchup data adjusts your view of the role; it doesn't create targets.
Think in whole numbers
Ask how often he reached five catches, not just whether his average exceeds 4.5.
Illustrative numbers, not a real player: catches of 9, 9, 3, 3, 3 and 3 average 5.0. Yet over 4.5 hit in only 2 of 6 games (33%), across that six-game sample.
A real Bet Check offers another example. Captured October 27, 2026, George Pickens' over 5.5 receptions check showed four hits in six games (67%), September 13 through October 18. His average was 5.5, but six catches were needed.
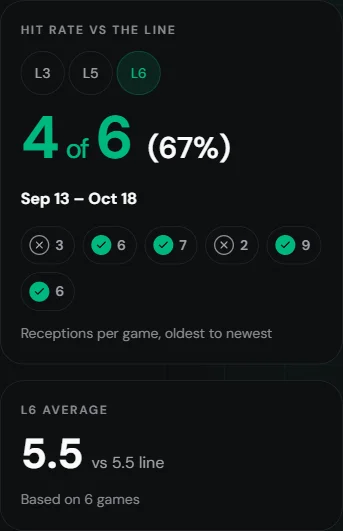
Open the image for full size. This historical October 26 check isn't an available bet or recommendation. The game was final but ungraded at capture; the displayed sample stopped on October 18.
For any log, keep an actual recorded zero below a positive over line. Don't turn a missing result or a game the player didn't play into zero catches. Sportsbook participation, early-injury and void rules are separate from historical hit-rate arithmetic. Read how to interpret prop hit rates before treating a percentage as a forecast.
Receptions vs receiving yards
Five catches for 25 yards clear over 4.5 receptions. Two catches for 80 yards don't. A yards prop rewards distance, including yards after the catch; a receptions prop gives each catch equal weight.
Choose the market that matches the role you're researching. Neither is automatically safer. For one-play yardage markets, see longest reception props.
Compare price and break-even
Break-even is the win rate needed to avoid losing money over repeated bets at that price, excluding pushes.
| Illustrative price | Break-even win rate |
|---|---|
| +100 | 50.0% |
| -110 | 52.4% |
| -150 | 60.0% |
At -150, you risk $150 to win $100: 150 / (150 + 100) = 60%. These aren't live quotes.
A historical rate above that threshold doesn't establish a future edge. Compare the same line across books using the line-shopping guide, and verify availability at the sportsbook.
Put the pieces together
Illustration only: a receiver takes 25% of 32 expected team targets. That's eight estimated targets. At an assumed 70% catch rate, the rough expectation is 5.6 catches.
That doesn't make over 4.5 a 70% proposition. The inputs are uncertain, and an expected count doesn't give the distribution of possible outcomes. Recheck role changes, compare actual games clearing five, and price the exact line.
Reading a receptions check
Confirm player, side, line and game first. Read the hit count, dates and displayed window rather than assuming every check uses ten games.
Where data is available, the matchup section can show targets per game, team target share and receptions allowed by position. Each has its own sample. Route participation isn't supplied on the check reviewed here; don't mistake snap share for routes or assume a catch-rate readout exists.
The Pickens check is a dated example, not today's offer. Prices may be recorded or closing quotes. Check timestamps and missing-data warnings, then confirm the current number at the book.
FAQ
What is a target in the NFL?
A target is a pass intended for a particular receiver, whether he catches it or not. A reception is a completed catch. Seven targets and five receptions means he caught five of the seven passes directed his way. Targets measure opportunities; receptions measure the catches that count toward the prop.
What's the best way to research a receptions prop?
Start with targets per game, target share and routes. Check target depth, the quarterback, expected game script, injuries and receptions allowed by the defense. Count games clearing the exact line, keeping the sample and window visible. Finally, compare the available price with its break-even win rate.
Is target share or catch rate more important for a receptions prop?
Start with target volume, using target share alongside the team's passing volume. Then use catch rate to judge how those opportunities become catches. Neither works alone: a large share of a small passing game can mean few targets, while a high catch rate on two targets still leaves little volume.
What's the difference between a receptions prop and a receiving yards prop?
A receptions prop counts catches; a receiving yards prop counts the yards credited on those catches. Five short catches can clear over 4.5 receptions without much yardage. Two long catches can clear a receiving yards line while missing that receptions over. The player's role matters more than his position label.
What happens to a receptions over if the player has 0 catches?
For an ordinary receptions over above zero that has action under your sportsbook's rules, zero catches is a loss. In a historical game log, a recorded zero is also below that line. Not playing and missing data aren't the same as zero catches. Check participation, injury and void rules separately.
Check the line before you bet
Check a receptions prop free. Start with your exact number, read the sample, then compare the price. Browse today's NFL props for the current board.
WagerLens is a research tool, not a sportsbook. No prop is a sure thing.
Gamble responsibly · 1-800-GAMBLER
See it live before you bet
NFL props with best prices, hit rates with sample sizes, and a public track record.
- Every pick graded — wins and losses, no filters
- Hit rates for the exact line and recent windows
- Sportsbook price comparison on free Bet Checks
- Premium adds tracking, history and stats, and alerts
- Public track record with wins and losses